
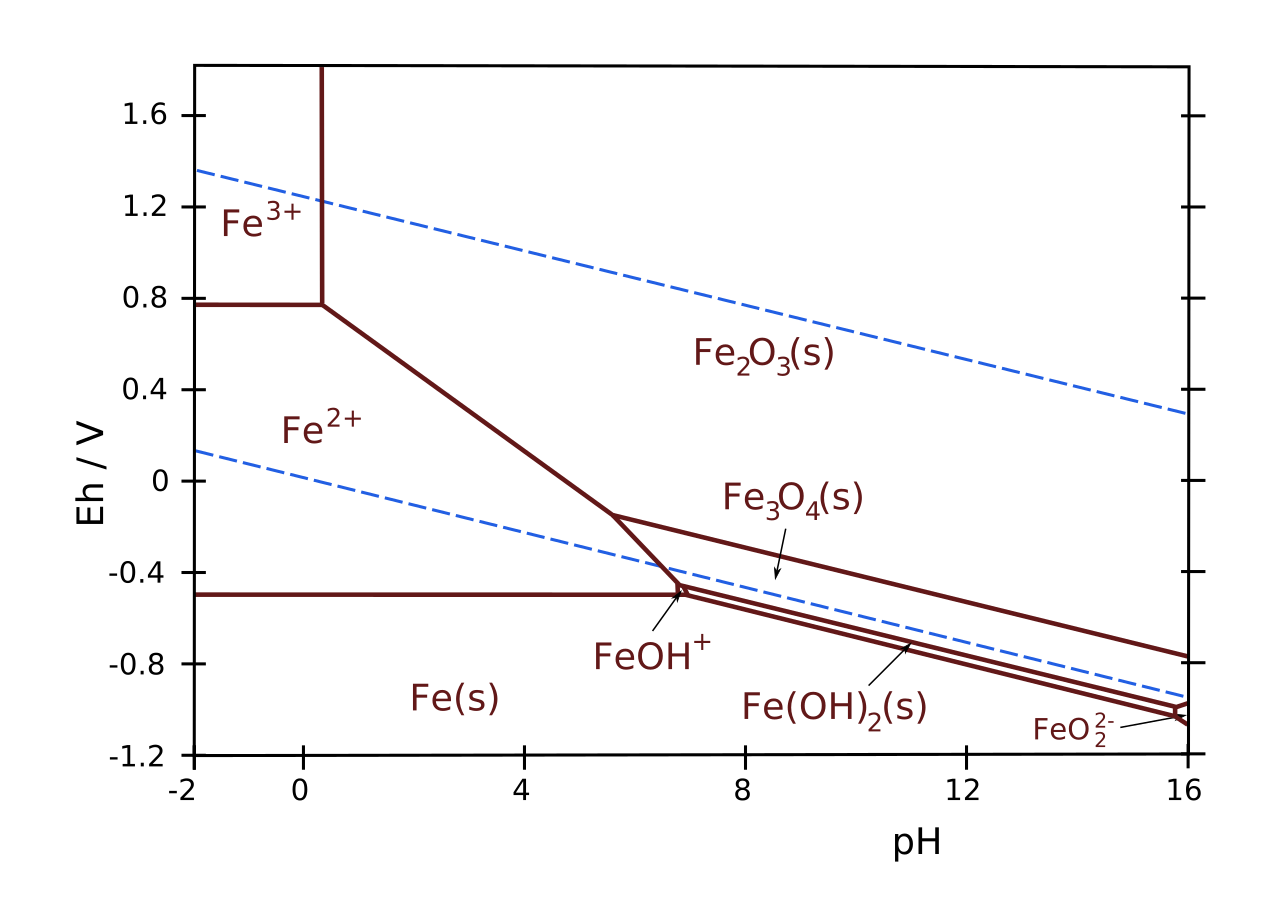
A corrosion process is not determined by the type of metal alone. Water chemistry, pH, oxygen availability, redox potential, temperature and dissolved-ion concentration are equally important. A Pourbaix diagram combines two key variables—pH and electrode potential—and shows which chemical form of an element is most stable under those conditions.
The diagrams are named after Marcel Pourbaix, who systematically presented electrochemical equilibria of metals in aqueous solutions as potential–pH maps. In corrosion engineering they are valuable because they separate three fundamental behaviours: immunity, active dissolution and passivation.
Key message: a Pourbaix diagram is a thermodynamic map of possible stable states. It is not a map of corrosion rate, protective-film quality or coating durability.
1. What is plotted on the axes?
The horizontal axis is pH, the negative base-10 logarithm of hydrogen-ion activity. Low pH denotes an acidic environment and high pH an alkaline one.
The vertical axis is electrode potential, usually expressed in volts versus the standard hydrogen electrode, SHE. A higher potential represents more oxidising conditions; a lower potential represents more reducing conditions and may stabilise the metallic state.
This is why pH alone cannot provide a complete corrosion prediction. Two waters with the same pH may have very different oxygen contents and redox potentials, and therefore lie in different stability regions.
2. Thermodynamic basis: Gibbs energy and the Nernst equation
Every boundary on a Pourbaix diagram represents equilibrium between two chemical species. The direction of a spontaneous reaction is determined by the change in Gibbs free energy. For an electrochemical reaction:
where n is the number of transferred electrons, F is the Faraday constant and E is the cell potential. At equilibrium there is no net driving force for conversion from one side of the reaction to the other.
The dependence of equilibrium potential on reactant and product activities is described by the Nernst equation:
At 25 °C, using a base-10 logarithm, it is commonly written as:
When H⁺ participates in the reaction, its activity can be expressed through pH. The equilibrium potential therefore becomes a linear function of pH for many reactions. For a general reduction half-reaction:
the boundary slope at 25 °C is approximately:
The proton-to-electron ratio determines the line slope. This is not merely geometric: the slope reveals the stoichiometry of the equilibrium represented by the line.
3. Why are some boundaries vertical, horizontal or sloped?
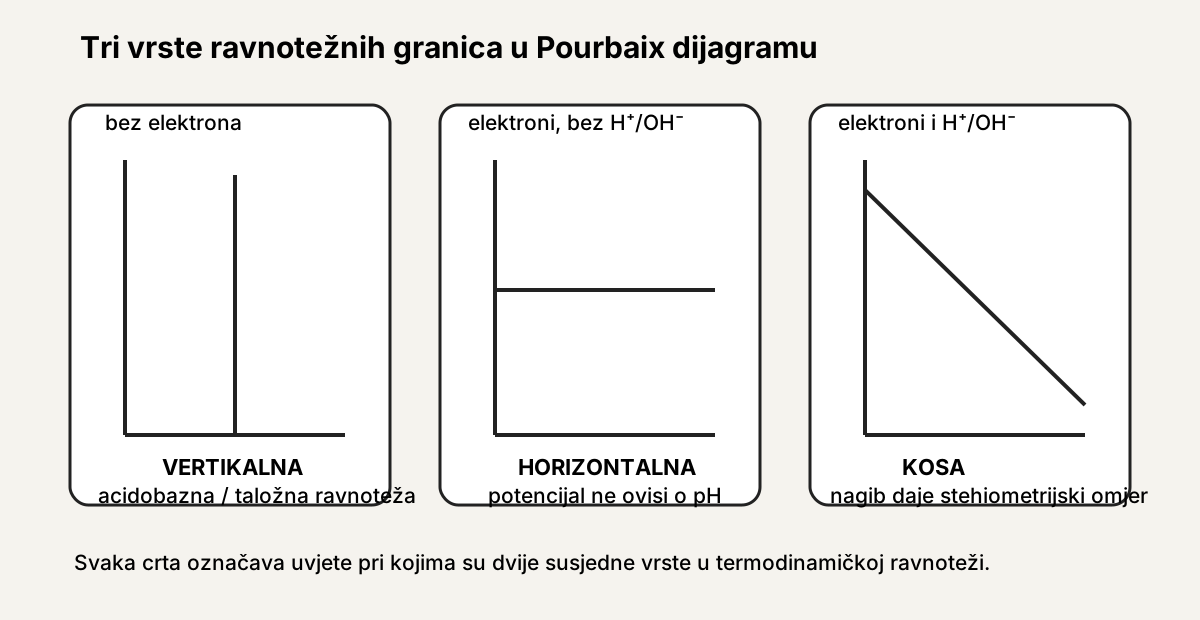
Vertical boundaries
These arise when a reaction does not involve electrons but depends on pH, as in acid–base, complexation or precipitation equilibria. Potential does not enter the expression, so the boundary is vertical.
Horizontal boundaries
These arise when electrons participate but H⁺ and OH⁻ do not. The equilibrium potential depends on oxidised and reduced species activities, but not on pH, so the line is horizontal.
Sloped boundaries
These arise when both electrons and protons or hydroxide ions participate. Potential then depends linearly on pH. Water stability limits are a typical example.
4. Water stability limits
Most Pourbaix diagrams show two sloped lines bounding the thermodynamic stability region of water. Below the lower line water can be reduced with hydrogen evolution; above the upper line water can be oxidised with oxygen evolution.
For gases at unit partial pressure and 25 °C, approximate equations versus SHE are:
Real water can persist outside these ideal limits because of overpotential and slow gas-evolution kinetics. A reaction may be thermodynamically possible yet too slow to proceed at an observable rate.
5. How should a Pourbaix diagram be read?
First check the conditions used to calculate the diagram: temperature, metal-ion activity, gas pressure and included solid and dissolved species. Only then should the actual pH and potential be plotted as an operating point.
The region containing the point identifies the thermodynamically predominant species:
- Metal phase: immunity. The metallic state is more stable than oxidised forms.
- Dissolved ion or complex: active corrosion, where dissolution is thermodynamically favourable.
- Solid oxide, hydroxide or sparingly soluble salt: passivation or formation of a solid corrosion product.
The term “passivation” must be used carefully. The diagram shows solid-phase stability but does not prove that the film is compact, non-porous, adherent or protective. Rust may be thermodynamically stable and still provide a poor barrier.
6. The iron–water system
Under sufficiently reducing conditions, metallic iron is stable. This is the immunity region and the principle behind cathodic protection: the structure potential is shifted negatively toward conditions where iron dissolution is not thermodynamically preferred.
At moderate potentials and from acidic to approximately neutral pH, dissolved Fe²⁺ or Fe³⁺ ions may be stable. This is the active-dissolution region, where carbon steel can pass into the electrolyte:
Under more alkaline or oxidising conditions, magnetite, hematite and oxyhydroxides become stable. The actual corrosion layer still depends on oxygen transport, wet–dry cycling, chlorides, carbonates, temperature and microstructure. A solid-oxide region is therefore not an automatic guarantee of durable protection.
Concrete and steel
The high pH of sound concrete pore water places reinforcement in the stability region of passive iron oxides. Carbonation lowers pH, while chlorides can locally break down the passive film even when average pH remains high. A classical Fe–H₂O diagram provides a framework but does not reliably predict chloride-induced local depassivation.
7. Zinc: acidic dissolution, protective products and amphoterism
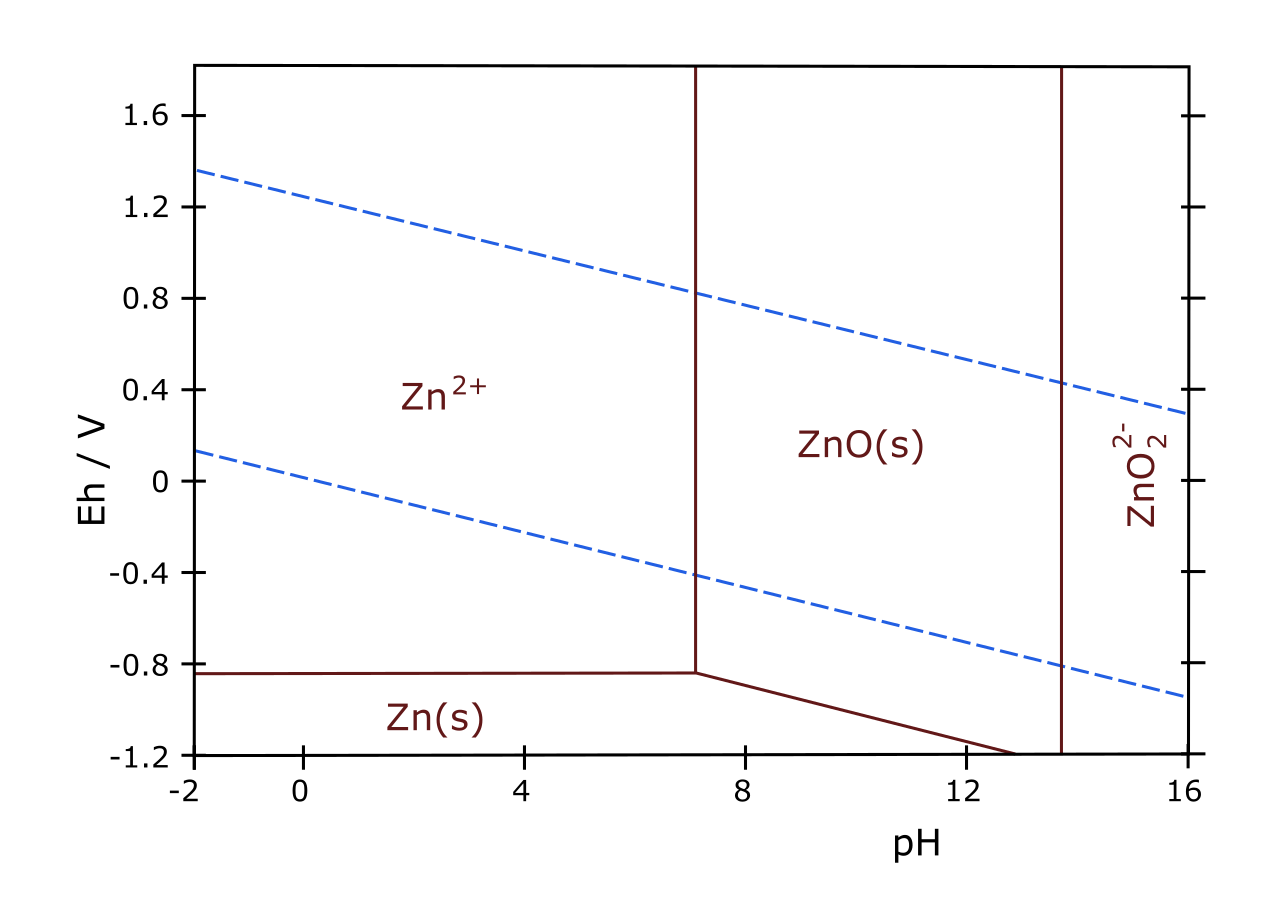
Zinc is electrochemically more active than iron, and its metallic form is stable at more negative potentials. In a galvanic couple with steel, zinc therefore carries the anodic reaction and can sacrificially protect damage in the coating.
In acidic conditions zinc readily dissolves as Zn²⁺. Near neutral and moderately alkaline conditions, ZnO, Zn(OH)₂ and atmospheric basic carbonates may form and slow further corrosion. In strongly alkaline environments, amphoteric zinc may dissolve again as soluble zincate species.
Practical consequence: the statement “zinc is resistant to alkali” is not generally valid. Behaviour depends on pH, potential, electrolyte chemistry and the stability of the actual protective products.
8. Aluminium and stainless steel: why passivation can be highly effective
Aluminium has a strong thermodynamic tendency to form Al₂O₃ and hydrated oxide phases. The film is extremely thin, compact and rapidly self-healing, so aluminium can be durable even though the metal itself is thermodynamically very reactive. Under strongly acidic and strongly alkaline conditions the protective film becomes soluble, reflecting the amphoteric behaviour of aluminium.
In stainless steels, passivity arises from a film enriched in chromium oxide. A simple diagram for pure chromium or iron cannot fully describe a multicomponent alloy, but it helps explain why sufficiently oxidising conditions favour the passive state, while strongly reducing or locally aggressive conditions may allow activation.
9. What does a Pourbaix diagram mean in corrosion-control practice?
Cathodic protection
By lowering the potential of a steel structure with an impressed-current system or sacrificial anodes, the operating point moves toward the immunity region. The protection criterion is not taken from an ideal Pourbaix diagram alone; the reference electrode, IR drop, polarisation, coating condition, current distribution, hydrogen evolution risk and applicable standards must also be considered.
Protective coatings
A coating primarily changes transport rather than equilibrium thermodynamics. It restricts the arrival of water, oxygen and ions at the metal and increases the electrical resistance of the corrosion cell. If water and salts penetrate through a defect, local pH and potential beneath the film may change. A Pourbaix diagram can then help explain which corrosion products may form, but it cannot predict underfilm corrosion rate, osmotic blistering or adhesion loss.
Surface preparation
Residual soluble salts, especially chlorides, may not appear explicitly in a simple metal–water diagram. Nevertheless, they change electrolyte conductivity, complex metal ions, affect product solubility and may destabilise passive films. A basic Pourbaix diagram is therefore never a justification for neglecting salt control before coating application.
Material selection and chemical processing
The diagrams help select pH ranges for pickling, passivation, phosphating, chemical cleaning and wastewater treatment. They can indicate where a metal ion is soluble, where a hydroxide precipitates and which oxidation state is stable. Real process baths require inclusion of complexing agents, chlorides, sulphates and other species that may substantially shift the boundaries.
10. A practical reasoning example
Consider steel in neutral, aerated water. The pH is approximately 7 and oxygen maintains a relatively positive potential. On an idealised Fe–H₂O diagram, the point may fall in an oxide-stability region. The wrong conclusion would be “the steel will not corrode.” The correct conclusion is: “a solid oxidised product is thermodynamically favoured; it must still be established whether the film is actually protective and how quickly it forms.”
If the same water becomes deaerated, its potential falls. The system may approach the Fe²⁺ active-dissolution region. If cathodic protection lowers the potential further, the metallic phase becomes more stable. This sequence demonstrates the value of the diagram: it organises reasoning but does not replace measurement and kinetic analysis.
11. Limitations that must not be ignored
- No corrosion rate. A large thermodynamic driving force does not necessarily mean a high corrosion current.
- Equilibrium is an assumption. Real systems are often metastable, transport-limited or affected by overpotential.
- The passive film is not mechanically characterised. The diagram does not show whether the layer is compact, porous, cracked or adherent.
- Concentration shifts the boundaries. A diagram for an ion activity of 10⁻⁶ is not the same as a diagram for 1 mol/L.
- Temperature changes the thermodynamics. Standard diagrams at 25 °C must not be applied automatically to hot processes.
- Alloys are not pure metals. Multicomponent systems require more complex calculations and phase data.
- Aggressive ions may be absent from the simplified system. Chlorides, sulphides, carbonates and complexing agents can completely change the picture.
- Localized corrosion is not predicted reliably. Pitting and crevice corrosion depend on local chemistry and breakdown potential.
12. Pourbaix and Evans: two halves of the real problem
A Pourbaix diagram describes what is thermodynamically possible and stable. An Evans or polarisation diagram describes the current at which anodic and cathodic reactions can proceed and where the corrosion potential is established. Serious corrosion analysis needs both views: equilibrium without kinetics is insufficient, while kinetics without understanding the possible phases can be misinterpreted.
Conclusion
Pourbaix diagrams are extremely powerful when used to answer the right question. They show the most stable form of a metal in an aqueous system as a function of pH and potential, providing a framework for understanding immunity, active dissolution and the formation of solid oxide or hydroxide phases.
Their greatest value is not that they independently “predict corrosion,” but that they discipline the analysis: what are the potential, pH and ion concentration; which phases are included; and is the equilibrium assumption realistic? Only then should kinetics, transport, surface condition, chlorides, film mechanics and actual service conditions be considered.
References and sources
- Marcel Pourbaix, Atlas of Electrochemical Equilibria in Aqueous Solutions, NACE.
- E. McCafferty, Introduction to Corrosion Science, Springer.
- R. Winston Revie (ed.), Uhlig’s Corrosion Handbook, Wiley.
- Denny A. Jones, Principles and Prevention of Corrosion.
- Mars G. Fontana, Corrosion Engineering.
- David A. Shifler (ed.), Corrosion and Electrochemistry of Zinc.
- ISO 8044 — Corrosion of metals and alloys — Vocabulary.
- ISO 12944 — Corrosion protection of steel structures by protective paint systems.
- ISO 15589 — Cathodic protection of pipeline transportation systems, where applicable.

Author
Branimir Krpez
Quality technician specialising in corrosion protection, protective coatings and quality control. On Zincor Systems, he publishes technical articles, analyses and case studies to share practical knowledge about corrosion and metal protection.
Send an email